Business Analytics is changing the way the Firms do Business. With the advent of the Information era, as more and more firms gear up to digitize their products, services, processes and information assets, a critical area of concern is to understand how these information and data may be analysed so that actionable insights may be taken by the firm.
Business analytics refers to the skills, technologies, applications and practices for the exploration and investigation of existing data assets to gain insight and drive business planning.
Business Analytics focuses on developing new insights and understanding of business performance based on data, predictive analytical models, data mining models, intelligent tools and statistical methods. It is used for strategic, operational and tactical decision making across industry verticals such as banking, financial services, telecom, manufacturing and retail.
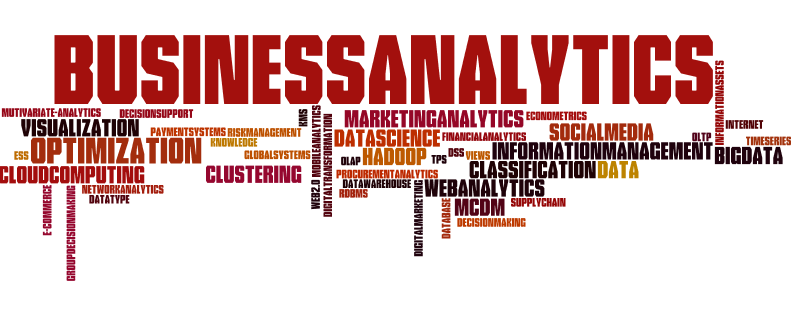
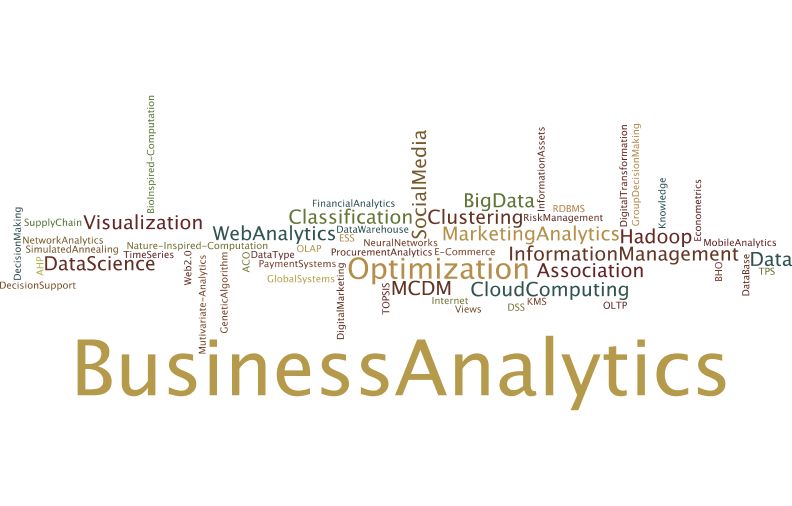
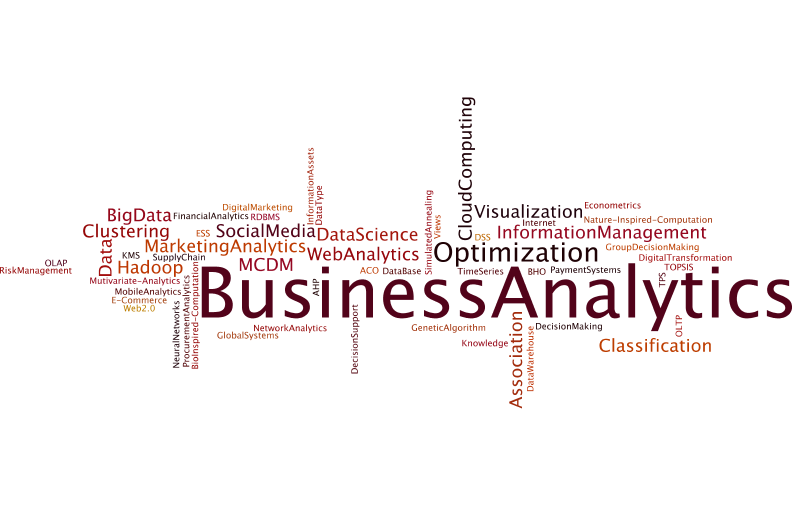
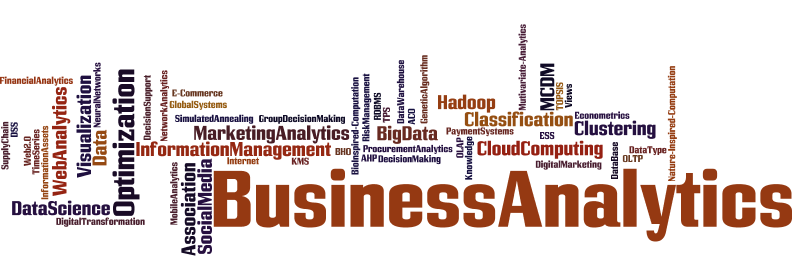
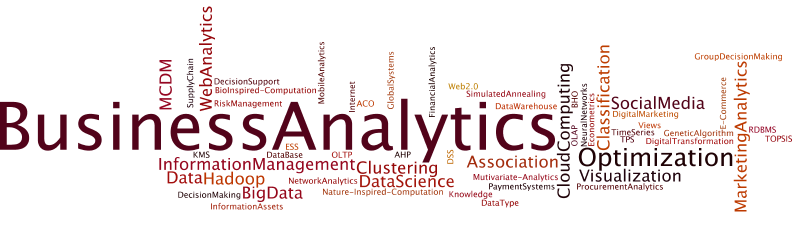
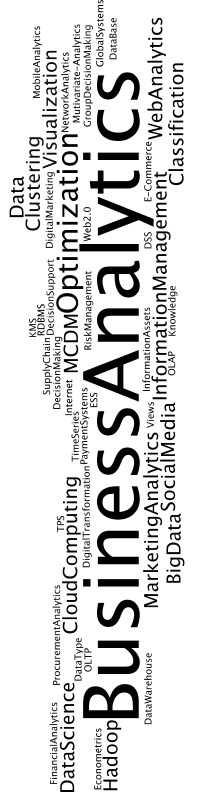
This article highlights some infographics developed through cloud words which highlight the dominant methods and domains within the discipline.


You must be logged in to post a comment.