Big Data refers to the huge volume of both structured and unstructured data that is being generated around the world and holds humongous information. It is predicted that the total data store might rise to 40 zettabytes by the year 2020.So important is this data that participants in the 2012 World Economic Forum in Davos, Switzerland, declared it a new class of economic asset. Big Data Analytics refers to the technique of computing this data to uncover patterns and new perspectives that can help businesses take decisions that will have a huge impact in the future .Organizations now need an analytic platform with higher capacity infrastructure at lower costs. From custom modeling and analytics, visualizations and dashboards to master data management and storage considerations such as cloud, the world of Big Data and the imperative to use big analytics will drive a disruptive change in the future of business .
Today, there are various platforms developed, one of which is by Revolution Analytics and named RRE 7.RRE7 is powered by R (a widely used statistical language described as Gartner to be the standard for Modern Analytics) and is a Big Data Analytics platform .It has a “write once deploy anywhere” functionality which helps data analysts use various data management platforms. It speeds up data insight and discovery.
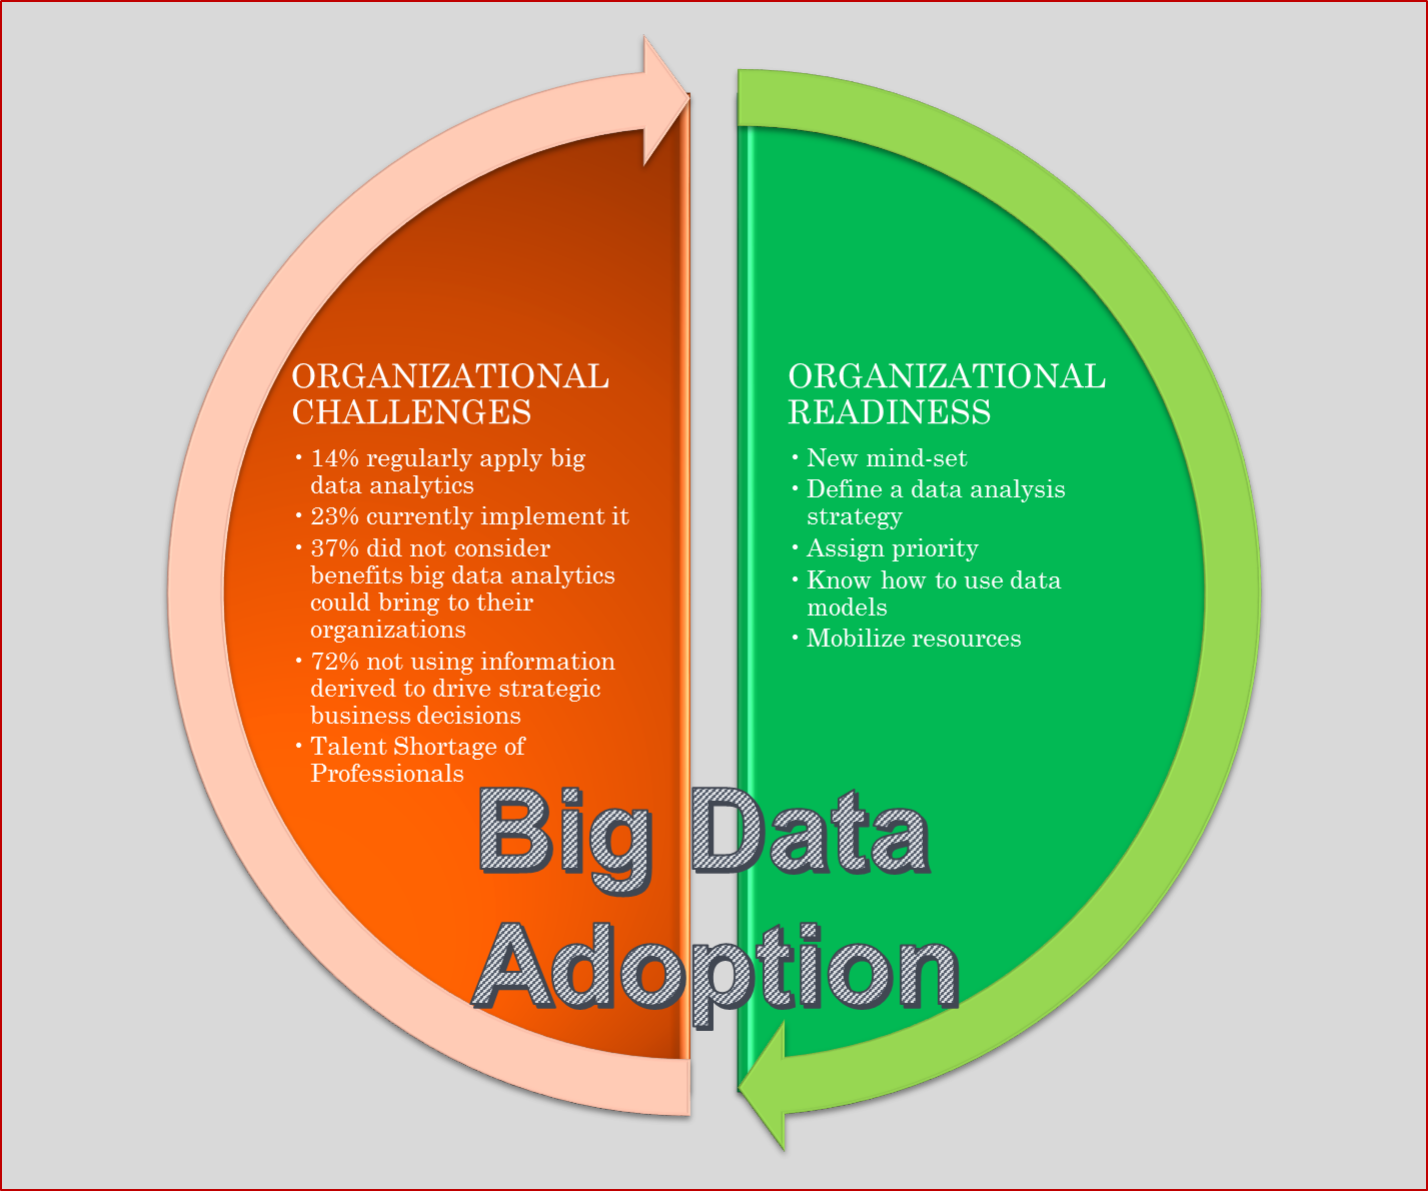
Big data analytics is of no value unless implemented to be used strategically by corporations. Various organizational changes are required to utilize big data analytics for better decision making and take advantage of the business opportunities being created by big data .Some of these changes are transforming the way a company does its day-to-day business. This requires the commitment and conviction of the senior management who can apply the knowledge, break down organizational barriers, and percolate a culture of using big data analytics to drive changes in business. This requires setting up of new-mind sets by top executives .The top management for this purpose would firstly need to possess knowledge about data analytics and be able to see how it can we used to bring organization – wide changes . It is only when people at the top change that the change trickles bottom down .Secondly, they need to define a data analytics strategy, assign priority to it and know how to use data models. There should be a clear plan about it. Also there is a need to mobilize resources to create new decision-support tools and help frontline managers exploit advanced analytics models.

In the hugely challenging economic scenario today, all branches of management can derive huge benefits from big data analytics. There is a need to drive business efficiency through better information management and analytics designed to address the challenges of complexity. If we look towards the finance function , big data analytics can be used by it in various ways .Finance can help the organization by handling the volume , variability of data ; to address data leakage ; enhance data governance ; use data as per the market context and foresee changes to develop actionable knowledge . For e.g. , the complex changing tax regulations is a challenge which the finance function can better tackle if braced with the knowledge and insights gained through big data analytics to better manage risks and benefit from planning opportunities.

This, they can achieve through deriving value from data, i.e. data relevance. They also need to apply analytics properly and get proper business outcomes .They need to use the right resources to perform analytics on relevant data which will help them gain an informed perspective enabling them to make better business decisions. The results should be in tune with the current context of the industry and the market. And many companies are actually doing this. From retail banks to hotel firms to health insurers , big data is being used by organizations giving rise to the Analytics 3.0 era where in companies are immersing themselves into this data-driven economy .
Data becomes big data when organizations when its volume/variety goes beyond the ability of the IT system. Hence organizations find it tough to “mine” it. Eg. Data from twitter feeds, call detail reports, etc. Hence it is vital to have data warehouse so that BI can be applied on summarized warehouse data. It is generally machine generated data , online reservation data, multi-channel marketing or sentiment analysis.
Hadoop is a popular choice when you need to filter, sort, or pre-process large amounts of new data in place and distill it to generate denser data that theoretically contains more “information”. Pre-processing involves filtering new data sources to make them suitable for additional analysis in a data warehouse. Analytics tools should be used with open source tools like Hadoop and MapReduce. The security of the data can be a challenge for some open source applications.
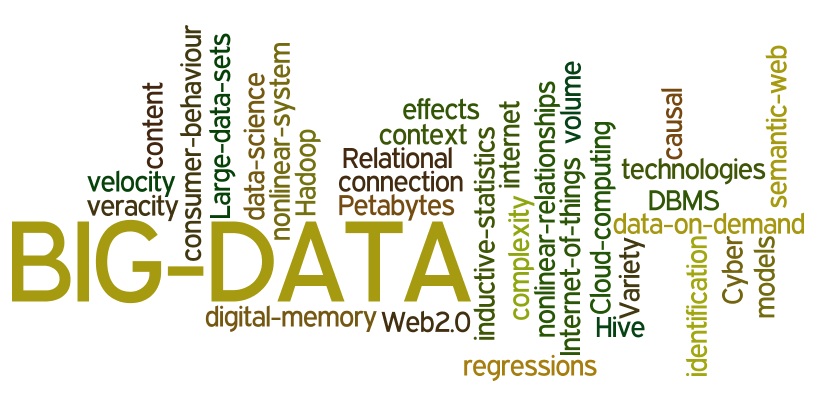
There is so much of talks on Big Data in recent times. The concepts of data science is gradually changing the way the web of petabytes of information may be viewed upon to make actionable insights from the same. Some of the dimensions which define Big Data are as follows:
- Volume – The quantity of data that is generated is very large (terabytes and petabytes) in these business context. It is the large size of the data which determines the value and potential of the data under consideration and whether it can actually be considered as Big Data or not.
- Velocity – The term ‘velocity’ in the context refers to the speed of creation of big data or how fast the data is created as well as processed to meet the requirements surrounding computing of the same.
- Variety – The next aspect of Big Data is its variety. Variety can consist of different types of data sets from different software. This means that the category to which Big Data belongs to is also a very essential fact that needs to be known by the data analysts.
- Veracity – The quality of the data being captured can vary greatly. Accuracy of analysis depends on the veracity of the source data.
- Variability – This is a factor which can be a challenge for those who analyze the data to derive meaningful insights. This refers to the inconsistency which can be demonstrated by the huge volumes of informationat times, thus hampering the process of being able to make sense of the data effectively.
- Complexity – Data management over such dynamic situations and contexts can become a very complex process, especially when large volumes of data come from multiple sources. These data need to be cleaned, linked, connected and correlated in order to be able to grasp the information that is supposed to be conveyed by these data.
Big Data Analytics , which surround the domain around making sense of big data consists of 6Cs. 6C systems focus on Connections, Cloud computing, Cyber models, Content and context, Community sharing & collaboration, and Customization.
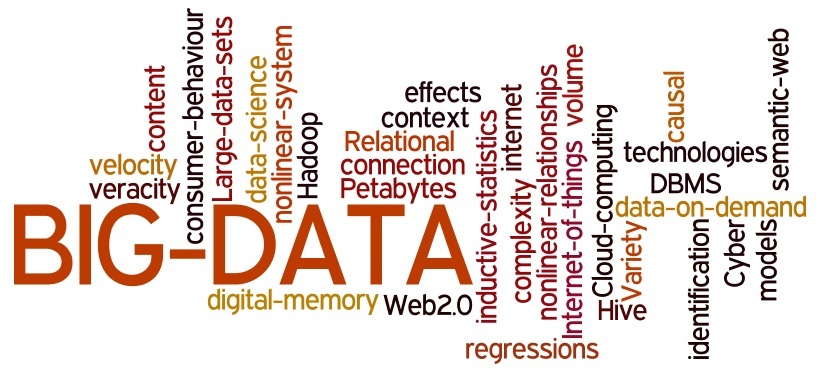
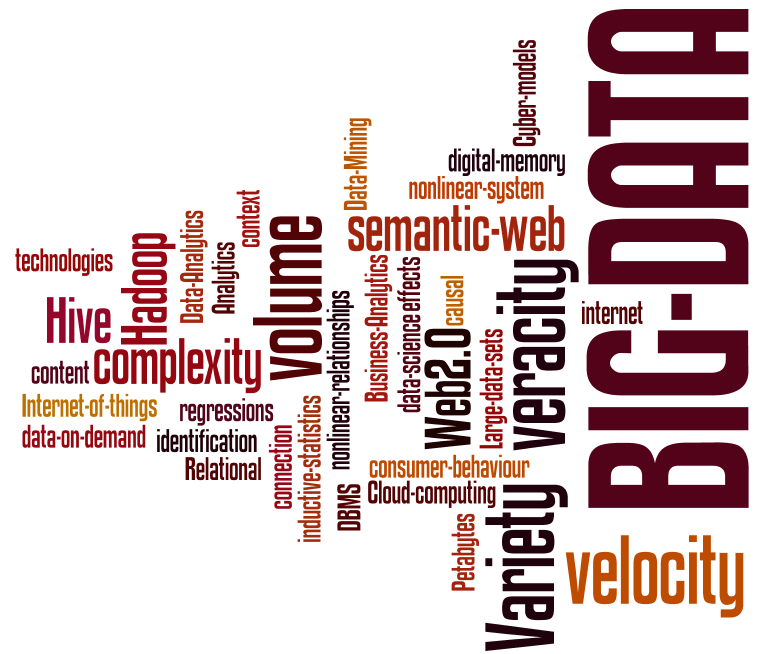
We present some infographics which denote the domain of Big Data for our readers, which may be used for presentations and other documentary purposes, since this domain is evolving so fast as a buzz word


You must be logged in to post a comment.