
The top 2% list of Researchers is out again. have created a publicly available database of top-cited scientists that provides standardized information on citations, h-index, co-authorship adjusted hm-index, citations to papers in different authorship positions and a composite indicator (c-score). Separate data are shown for career-long and single recent year impact. Metrics with and without self-citations, ratio of citations to citing papers, retracted papers (based on Retraction Watch database) and citations to/from retracted papers are also shown to facilitate mapping of potential research integrity issues. Scientists are classified into 20 scientific fields and 174 sub-fields (Science-Metrix classification). Field- and subfield-specific percentiles are also provided for all scientists with at least 5 papers.
This list has 6954 Indians based on single year performance in the 2026 edition. The Indian data subset is uploaded for reference. An drill down was undertaken to understand the ranks and impact that the growing Indian scholarship has globally, based on this data. The overview of findings is presented below.
Ioannidis, John P.A. (2026), “August 2026 data-update for “Updated science-wide author databases of standardized citation indicators””, Elsevier Data Repository, V9, doi: 10.17632/btchxktzyw.9
The India tab has 6,954 researchers with Indian affiliation spread across 1,759 distinct inst_name values. Here are the top 20, counted exactly as the names appear. Three institutions tie at 50 for 19th place, so the table has 21 rows.
| Rank | Institution (inst_name) | Faculty listed | % of India list |
|---|---|---|---|
| 1 | Indian Institute of Science | 113 | 1.6% |
| 2 | Indian Institute of Technology Delhi | 104 | 1.5% |
| 3 | Indian Institute of Technology Kharagpur | 84 | 1.2% |
| 4 | Vellore Institute of Technology | 78 | 1.1% |
| 5 | Indian Institute of Technology Roorkee | 73 | 1.0% |
| 6 | Indian Institute of Technology Bombay | 72 | 1.0% |
| 7= | Indian Institute of Technology Madras | 61 | 0.9% |
| 7= | All India Institute of Medical Sciences, New Delhi | 61 | 0.9% |
| 9= | Saveetha School of Engineering | 59 | 0.8% |
| 9= | Saveetha Institute of Medical and Technical Sciences | 59 | 0.8% |
| 11 | Indian Institute of Technology (BHU) Varanasi | 57 | 0.8% |
| 12 | Lovely Professional University | 56 | 0.8% |
| 13= | Academy of Scientific and Innovative Research (AcSIR) | 55 | 0.8% |
| 13= | PGIMER, Chandigarh | 55 | 0.8% |
| 15 | Amity University | 54 | 0.8% |
| 16 | Indian Institute of Technology Kanpur | 52 | 0.7% |
| 17= | Chitkara University, Punjab | 51 | 0.7% |
| 17= | Banaras Hindu University | 51 | 0.7% |
| 19= | Graphic Era (Deemed to be University) | 50 | 0.7% |
| 19= | Jadavpur University | 50 | 0.7% |
| 19= | BITS Pilani | 50 | 0.7% |
The list is very spread out: even the top institution has under 2% of India’s listed researchers. Just below the cut are IIT Guwahati (49) and Aligarh Muslim University (46). Some institutions appear under more than one spelling or campus name, which changes the rankings if you combine them:
- Saveetha: its five entries add up to 147 (59 + 59 + 13 + 11 + 3, plus 1 typo). Combined, it would rank #1, ahead of IISc.
- VIT: Vellore (78) plus the Chennai campus (21) makes 99, which would be #3.
- IIT Delhi goes up to 106 and IISc to 114 once department-level entries like “…, Department of Management Studies” are added.
- BHU: counting the Institute of Medical Sciences takes it to 59. IIT (BHU) is listed separately.
- Manipal: spread across about 12 entries (for example Manipal Institute of Technology 28 and Manipal University Jaipur 21), so it doesn’t make the top 20 as listed.
- AcSIR is the degree-granting body for the CSIR labs, so it’s an umbrella rather than a single campus.
The dominant areas of research in terms of subfields is represented here as a word cloud.
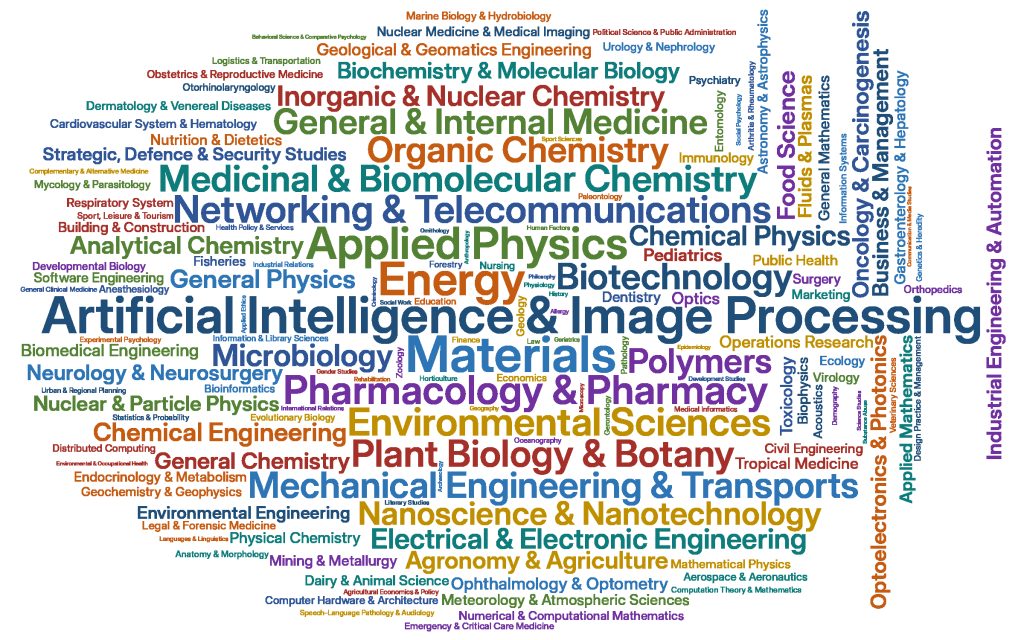
The five largest areas are:
- Artificial Intelligence & Image Processing: 919
- Materials: 895
- Energy: 741
- Applied Physics: 694
- Pharmacology & Pharmacy: 535
Those are followed by Environmental Sciences, Networking & Telecommunications and Plant Biology & Botany.
Note: This is purely an analysis based on the data and not a comment on the quality or impact of these publications in any of these listed universities.


